
| Grade Level | System Requirement | Product Number |
|---|---|---|
| Grades 5-12 | Apple IIGS (768K) | A300 |
| USA GeoGraph has been updated to include the latest data from the 1990 U.S. Census. Students in your class access demographic, social, environmental, and economic data through maps and a database. Any changes made to the maps are automatically reflected in the database and vice versa. Ideal for individual study, group lessons, and your presentations. * Contains more than 30 maps and more than 20 thematic overlays. * Features a database with more than 100 categories. | ||
Introduction
What is USA GeoGraph?
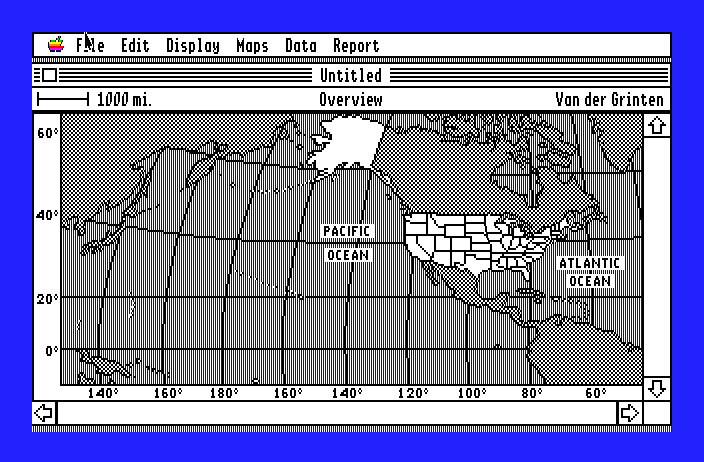
USA GeoGraph is a geography discovery-learning tool. That may sound a bit dull at first, but USA GeoGraph is anything but dull! In fact, it’s an important development in geographic education. You can use its on-screen maps, graphs, and database to explore the fifty states and six U.S. territories (including the District of Columbia) as well as to better understand basic concepts of geography. But the real beauty of USA GeoGraph is that it functions as a “living map” because its maps and database are interactive. That is, what you do with maps affects the database and vice versa. As a result, you can explore the United States in many different ways-whichever is best suited to your goals and your own particular style.
The on-screen maps in USA GeoGraph are among the most detailed, accurate maps you’ve seen on a microcomputer. In addition, the memory capabilities of the Apple Ilos allow you to manipulate those maps and the accompanying database (which includes 105 categories of information) in ways that will help you understand and appreciate the differences among states and territories and the patterns that emerge as you use the computer to explore the nation.
The focus of USA GeoGraph is on “human geography,” the relationship between where people live and how they live. USA GeoGraph includes information about the physical, demographic, economic, and cultural aspects of the United States, but its ultimate aim is to help you understand and appreciate the differences-and similarities–of people around the country and how they go about working with what their environments provide.
The true value of USA GeoGraph lies in its power as a flexible investigative tool. You can use USA GeoGraph to help you learn to think like a geographer, so to speak. It’s designed to aid in developing inquiry and analytical skills in the field of geography. The on-screen maps, graphs, and database functions in USA GeoGraph will help you become more proficient at asking and answering important, meaningful questions about the United States.
While USA GeoGraph is indeed a powerful tool, it is just that: one of many tools you should use in geographic education. Textbooks, encyclopedias, atlases, wall maps, and globes all have vital roles to play in the geography learning process. Together with these other tools, USA GeoGraph can enhance geographic education, helping to make it exciting and meaningful.
For more information about USA GeoGraph, including its instructional objectives and the equipment you need to use it, turn to the section of this User’s Guide entitled “The Product at a Glance.” But, before you do that, you might want to know a little bit about some of the basic concepts that inspired and guided USA GeoGraph’ s design.